
Last week, I discussed the hitters whose projections have changed by the largest amount (for better or worse) according to their OOPSY projections. OOPSY is a new projection system first available to the public this year, created by Jordan Rosenblum.
In contrast with many projection systems which have been around for a longer period, OOPSY factors in new metrics, like bat speed for hitters and Stuff+ for pitchers. Those stats become meaningful in smaller samples, which has a knock-on effect on the projections, allowing OOPSY to change its mind on players more quickly than a traditional projection system can.
For this week's Barometer, I'm going to repeat the exercise we went through last week but with starting pitchers this time. (Relievers won't be part of this series, but shoutout to Giants' All-Star setup man Randy Rodriguez, who improved his projected ERA from 3.80 all the way to 3.15.) As with hitters last week, we'll go tier by tier among the starting pitchers according to their preseason projections, looking for the largest projected ERA changes in each tier.
Rest of Season Starting Pitcher Projection Risers
| Great Starters (below 3.60) | Team | Preseason ERA | Rest-of-Season ERA | Diff |
|---|---|---|---|---|
| Hunter Brown | HOU | 3.56 | 3.22 | -0.34 |
| Tarik Skubal | DET | 2.74 | 2.48 | -0.26 |
| Logan Webb | SFG | 3.46 | 3.25 | -0.21 |
| Zack Wheeler | PHI | 3.21 | 3.00 | -0.20 |
| Max Fried | NYY | 3.41 | 3.22 | -0.20 |
 Hunter Brown, Astros: All of these improvements are encouraging, and it would be unfair to Skubal to skip over the fact that he's
Last week, I discussed the hitters whose projections have changed by the largest amount (for better or worse) according to their OOPSY projections. OOPSY is a new projection system first available to the public this year, created by Jordan Rosenblum.
In contrast with many projection systems which have been around for a longer period, OOPSY factors in new metrics, like bat speed for hitters and Stuff+ for pitchers. Those stats become meaningful in smaller samples, which has a knock-on effect on the projections, allowing OOPSY to change its mind on players more quickly than a traditional projection system can.
For this week's Barometer, I'm going to repeat the exercise we went through last week but with starting pitchers this time. (Relievers won't be part of this series, but shoutout to Giants' All-Star setup man Randy Rodriguez, who improved his projected ERA from 3.80 all the way to 3.15.) As with hitters last week, we'll go tier by tier among the starting pitchers according to their preseason projections, looking for the largest projected ERA changes in each tier.
Rest of Season Starting Pitcher Projection Risers
| Great Starters (below 3.60) | Team | Preseason ERA | Rest-of-Season ERA | Diff |
|---|---|---|---|---|
| Hunter Brown | HOU | 3.56 | 3.22 | -0.34 |
| Tarik Skubal | DET | 2.74 | 2.48 | -0.26 |
| Logan Webb | SFG | 3.46 | 3.25 | -0.21 |
| Zack Wheeler | PHI | 3.21 | 3.00 | -0.20 |
| Max Fried | NYY | 3.41 | 3.22 | -0.20 |
Hunter Brown, Astros: All of these improvements are encouraging, and it would be unfair to Skubal to skip over the fact that he's gone from trailing Paul Skenes by 0.19 runs to leading Skenes by 0.29 runs, making him OOPSY's top projected starting pitcher. But Brown's improvement is perhaps the most notable, both because it's the largest in this group and because it's happening for a player who, at 26 years old, may still be right at the start of his prime. Given that Brown leads all qualified starters with a 1.82 ERA and sits fourth (behind Skubal, Webb and Wheeler) with a 2.67 xFIP, even his improved ERA projection still seems high.
Brown has reached this new level by taking a big step forward in his already strong bat-missing ability. Through his first three seasons, he managed a 26.0 percent strikeout rate, a mark which would rank 19th among qualified starters this year. This season, he ranks third among qualified starters with a 32.1 percent strikeout rate. That jump in strikeouts is matched by a jump in whiff rate, which sits at 29.1 percent, well above his previous career high of 25.1 percent.
That improvement, in turn, is thanks to an improvement in the quality of Brown's arsenal. He's added nearly a full tick to his fastball, which has gone from 96.1 mph to 96.9, and Stuff+ rates the pitch at 117, well above its previous career average of 105. Brown's sinker (111 to 117), cutter (98 to 102) and knuckle curve (100 to 107) are also up significantly in Stuff+. Measurably better stuff across the board is likely driving OOPSY's improved opinion of him.
| Good Starters (3.60-4.00) | Team | Preseason ERA | Rest-of-Season ERA | Diff |
|---|---|---|---|---|
| Hunter Greene | CIN | 3.61 | 3.29 | -0.32 |
| Shane McClanahan | TBR | 3.62 | 3.31 | -0.30 |
| Cristopher Sanchez | PHI | 3.64 | 3.35 | -0.29 |
| Nathan Eovaldi | TEX | 3.83 | 3.68 | -0.15 |
| Ranger Suarez | PHI | 3.96 | 3.82 | -0.14 |
 Cristopher Sanchez, Phillies: The projections back up what the results tell us: Sanchez has reached a new level and should now be seen as a genuine front-line starter, not merely a mid-rotation arm with upside. Sanchez was already a popular sleeper this past draft season after posting a 3.32 ERA in his first full season as a starter last year, with a strong walk rate (5.8 percent) and groundball rate (57.4 percent) offsetting a slightly sub-par strikeout rate (20.3 percent).
This year, he's maintained a similar walk rate (6.8 percent) and groundball rate (57.2 percent) but has paired those numbers with a much better strikeout rate (26.2 percent). No other qualified starter with a groundball rate north of 55 percent has a strikeout rate that high or a walk rate that low; the closest comparison would be Logan Webb, who has the slight edge in strikeouts (27.2 percent) and walks (5.5 percent) but trails Sanchez in grounders (52.8 percent).
Sanchez's strikeout improvements are the product of improved stuff. After a much-publicized effort to increase his velocity this spring, Sanchez came out of the gates averaging 96.5 mph on his sinker in his season debut, though after a forearm scare in his fifth outing, he's settled in at 95.2 mph over his last 12 starts — still an improvement on his 94.5 mph from last season. Looking just as those last 12 starts, his sinker Stuff+ sits at 112 (up from 103 last year), his slider Stuff+ sits at 109 (up from 105) and his changeup sits at 119 (up from 113). Overall, his 114 Stuff+ trails only Tarik Skubal and Garrett Crochet among qualified starters. Sanchez has struggled to command his improved arsenal at times this season, but he's now gone four straight starts without walking a batter. If he's able to maintain that elite control alongside his newfound elite stuff, he'll be an ace.
| Average Starters (4.00-4.30) | Team | Preseason ERA | Rest-of-Season ERA | Diff |
|---|---|---|---|---|
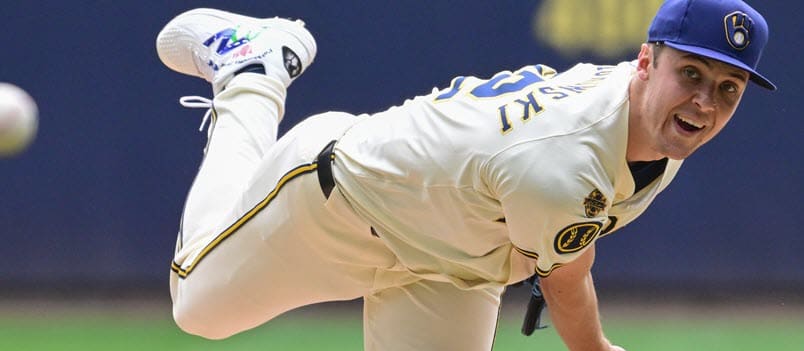
| Jacob Misiorowski | MIL | 4.08 | 3.49 | -0.59 |
| Merrill Kelly | ARI | 4.29 | 4.02 | -0.26 |
| Shane Baz | TBR | 4.15 | 3.94 | -0.22 |
| Kris Bubic | KCR | 4.14 | 3.93 | -0.21 |
| MacKenzie Gore | WSN | 4.09 | 3.92 | -0.17 |
 Jacob Misiorowski, Brewers: It didn't take long for OOPSY to be convinced that Misiorowski would be an impact starter at the big-league level. Interestingly, that's not an attitude universally shared among the projection systems. Steamer has actually lowered its opinion of him, going from a projected 3.96 ERA to 4.33, while ZiPS, which was already skeptical, has gone from 4.92 to 5.04. If there was ever going to be a pitcher who elicited such wildly different responses from the algorithms, it makes sense that it would be one with such extreme strengths and weaknesses like Misiorowski, a pitcher whose top-of-the-scale stuff and bottom-of-the-scale command make for a difficult combination to parse, especially after just four starts.
Throughout his minor-league career, which spanned 233.2 innings, Misiorowski produced a strong 3.04 ERA, with an elite 32.1 percent strikeout rate offsetting an awful 14.0 percent walk rate. In four MLB starts, the numbers are remarkably similar: a 3.20 ERA, with a 28.0 percent strikeout rate so far offsetting a 13.3 percent walk rate. Misiorowski's 99.3 mph fastball would lead all qualified starts by more than a full tick (Paul Skenes sits second at 98.2 mph), and his 127 Stuff+ on the pitch would lead all qualified starters by 10 points. His 94.4 mph slider would lead all qualified starters by 3.6 mph, and it would even be the fastest cutter among qualified starters if it were to be reclassified.
That outlier stuff is enough to convince a stuff-based projection system like OOPSY, but it's too early to say whether the stuff will continue to overwhelm the command concerns going forward. Just one qualified starter has finished with a walk rate north of 11.6 percent in the last decade, though the guy who did it — Blake Snell in 2023 — won a Cy Young, offering reason to believe this might just work for Misiorowski.
| Poor Starters (above 4.30) | Team | Preseason ERA | Rest-of-Season ERA | Diff |
|---|---|---|---|---|
| Brandon Walter | HOU | 4.34 | 3.85 | -0.50 |
| Quinn Priester | MIL | 4.36 | 3.92 | -0.44 |
| Didier Fuentes | ATL | 4.88 | 4.48 | -0.40 |
| Adrian Houser | CHW | 4.88 | 4.53 | -0.34 |
| Ryan Bergert | SDP | 4.98 | 4.71 | -0.27 |
Quinn Priester, Brewers: Priester could hardly be a more different pitcher than Misiorowski, yet the Brewers' pitching development staff has seemingly helped both take significant steps forward this season. While Misiorowski dominates with triple-digit heat, Priester almost never throws a four-seam fastball, instead relying on a 93.7 mph sinker as his primary pitch. That pitch has helped him to a 57.7 percent groundball rate, fourth-best among pitchers who have thrown at least 80 innings this season.
While he's not in the same tier as other groundball specialists like Cristopher Sanchez or Framber Valdez, who combine similar groundball numbers with strong strikeout numbers, there are plenty of other starters who have found success by combining excellent groundball rates with sub-par but not terrible strikeout rates (like Priester's 18.7 percent). Clay Holmes (19.5 K%, 53.4 GB%) and David Peterson (20.2 K%, 56.7 GB%) stand out as two notable examples this season.
Priester had a nearly identical groundball rate (57.7 percent) last season but struggled to miss bats, striking out just 14.9 percent of opposing batters en route to a 4.71 ERA. By adding 0.6 mph to his sinker and trading his four-seamer for a cutter, however, Priester is now able to miss just enough bats that his groundball-heavy profile is now easier to trust, as his improved projections indicate.
Rest of Season Pitcher Projection Fallers
| Great Starters (below 3.60) | Team | Preseason ERA | Rest-of-Season ERA | Diff |
|---|---|---|---|---|
| Roki Sasaki | LAD | 3.55 | 4.82 | 1.27 |
| Brandon Woodruff | MIL | 3.32 | 4.02 | 0.70 |
| Andrew Painter | PHI | 3.33 | 3.90 | 0.57 |
| Landen Roupp | SFG | 3.48 | 3.97 | 0.49 |
| Blake Snell | LAD | 3.27 | 3.68 | 0.40 |
 Roki Sasaki, Dodgers: Projections for players coming over from foreign leagues shouldn't necessarily be treated the same way as projections for players who have already played in the majors, especially for newer projection systems like OOPSY, which rely on metrics like Stuff+ which aren't available in the same way for overseas leagues. With a projection presumably based mostly on translated NPB stats, OOPSY viewed Sasaki very similarly to ATC (3.52), Steamer (3.54) and ZiPS (3.57) heading into the year. While those projection systems have also adjusted their outlook on Sasaki, they've only done so by a modest amount, with projected ERAs ranging from 3.85 to 4.15. OOPSY, on the other hand, is now all the way out on the supposed phenom.
It's not hard to see why a projection system that's designed to react quickly would move by such a large amount on Sasaki, who wasn't just bad in his first eight MLB starts, but terrible. His 4.72 ERA actually counts as a significant overperformance, with his 5.73 xFIP and 5.75 SIERA indicating things could have been much worse if not for a .232 BABIP. His 15.6 percent strikeout rate was quite poor — just seven qualified starters this season have a lower mark — but his 14.3 percent walk rate was even worse. The last time a qualified starter had a walk rate that high was Randy Johnson back in 1992.
Johnson, of course, eventually figured out where his overpowering stuff was going and became a Hall of Famer, which could offer reason for optimism for those holding onto Sasaki in dynasty leagues. It's unclear that Sasaki fits the "overpowering stuff" part of that formula, though, despite twice eclipsing a 35 percent strikeout rate in Japan. Stuff+ does like his sinker, giving it a mark of 110, but his four-seamer has a Stuff+ of 78 despite coming in at 96.0 mph thanks to a poor movement profile. If he returns from his shoulder injury with similar stuff, it will be hard to buy back in.
| Good Starters (3.60-4.00) | Team | Preseason ERA | Rest-of-Season ERA | Diff |
|---|---|---|---|---|
| Sean Burke | CHW | 3.97 | 4.63 | 0.66 |
| Aaron Civale | CHW | 3.98 | 4.52 | 0.54 |
| Zach Eflin | BAL | 3.89 | 4.39 | 0.51 |
| Taj Bradley | TBR | 3.68 | 4.13 | 0.45 |
| Lance McCullers Jr. | HOU | 3.79 | 4.22 | 0.44 |
 Sean Burke, White Sox: Burke entered 2025 with a fair amount of promise, having produced a 1.42 ERA and 28.9 percent strikeout rate in his 19-inning debut after striking out 29.4 percent of the batters he faced across his minor-league career. While his preseason OOPSY projection looks more or less accurate so far — he owns a 4.03 ERA through 17 appearances (14 starts and three outings as a follower) — his revised outlook is much less rosy and is more in line with his poor ERA estimators, including a 4.70 SIERA and 4.95 xFIP.
Nothing in Burke's secondary statistics looks particularly positive at the moment. His walk rate, which was a problem for him through the minors, sits at a poor 10.0 percent, and he's failing to keep the ball on the ground, managing just a 33.5 percent groundball rate. Both marks rank 10th-worst among the 90 pitchers who have thrown at least 80 innings this season. He could potentially overcome weaknesses those if he was still missing bats at a similar rate to his minor-league and rookie numbers, but instead, his strikeout rate has collapsed to 19.2 percent.
Stuff+ does think his four-seamer is pretty good, giving it a mark of 102, but none of his secondaries rate higher than 88. The only pitch getting good results is his curveball, which has held hitters to a .269 wOBA, but even that offering comes with a .342 xWOBA, so that's unlikely to continue. There just doesn't seem to be a very interesting pitcher here at the moment, as the updated projections indicate.
| Average Starters (4.00-4.30) | Team | Preseason ERA | Rest-of-Season ERA | Diff |
|---|---|---|---|---|
| Jeffrey Springs | ATH | 4.05 | 4.67 | 0.62 |
| Cade Povich | BAL | 4.18 | 4.63 | 0.44 |
| Luis Severino | ATH | 4.04 | 4.46 | 0.42 |
| Randy Vasquez | SDP | 4.27 | 4.67 | 0.40 |
| Dean Kremer | BAL | 4.26 | 4.60 | 0.34 |
 Jeffrey Springs, Athletics: Some of the rise in Springs' ERA may be due to the projections realizing just how hitter-friendly the Athletics' new minor-league home is in Sacramento, but this new projection for Springs also seems to reflect his degrading skillset. Springs spent most of his career as a reliever before moving to the rotation in 2022, cruising to a 2.26 ERA and 1.01 WHIP in 151.1 innings in 2022-23 while striking out 27.8 percent of opposing batters and walking just 5.8 percent.
Springs' fastball averaged an already unremarkable 91.7 mph in those seasons, but when he returned from Tommy John surgery late last year, he averaged just 90.0 mph across seven starts. The results were still there — a 3.27 ERA and 26.1 percent strikeout rate — but perhaps the A's should have been more wary before acquiring him in a five-player deal which sent Joe Boyle the other way in December.
Springs has regained a bit of velocity this year, but his results are more in line with what you'd expect from someone with a 90.6 mph fastball. His 4.07 ERA could be much higher according to his 4.73 xFIP and 4.65 SIERA. His fastball Stuff+ sits at 89, and his only pitch to rise above 95 is his changeup, which at 102 Stuff+ is well below its peak of 113 two seasons ago. A crafty lefty with poor velocity but a good changeup is a profile that can work as a back-end starter, but that's a big step down from what Springs was prior to his surgery, and considering his 9.0 percent walk rate, it's not clear he has the command necessary to qualify for the "crafty" label.
| Poor Starters (above 4.30) | Team | Preseason ERA | Rest-of-Season ERA | Diff |
|---|---|---|---|---|
| Antonio Senzatela | COL | 5.34 | 5.84 | 0.51 |
| Tomoyuki Sugano | BAL | 4.55 | 4.99 | 0.44 |
| Lucas Giolito | BOS | 4.35 | 4.73 | 0.38 |
| Jake Irvin | WSN | 4.34 | 4.67 | 0.33 |
| Jose Quintana | MIL | 4.40 | 4.70 | 0.29 |
 Lucas Giolito, Red Sox: Most of the pitchers in this tier were already pretty unappealing for fantasy purposes, but it's discouraging to see Giolito in this kind of company. The 30-year-old righty has been on a great run recently, allowing just three earned runs in last five starts to lower his ERA to 3.66 in his first season back from elbow surgery, but OOPSY is far from convinced. It's not alone: Steamer, ZiPS, ATC and THE BAT have all raised their projected ERAs for Giolito since the start of the season.
Giolito has indeed outperformed his ERA estimators, though if he falls back to his 4.03 xFIP or 4.16 SIERA the rest of the way, he'll still be far ahead of his rest-of-season projections. He isn't missing bats like he used to, though, with his 21.1 percent strikeout rate falling significantly behind the 28.3 percent mark he had in his last five healthy seasons. His whiff rate has fallen to the same 21.1 percent mark after not coming in below 28.5 percent in any of those same five seasons.
There is reason for optimism with Giolito, though, as his strikeout rate has rebounded to 24.8 percent over his last five starts. His Stuff+ is up over those five outings, too, but while a Stuff+ of 96 is at least much better than the 88 Stuff+ he managed over his first seven starts, it's still unimpressive. Giolito was all the way up at 111 Stuff+ in 2020, the year he had a 3.48 ERA, but he was at just 96 and 97 Stuff+ in 2022 and 2023, years in which he posted ERAs of 4.90 and 4.88. With that context, perhaps his poor projections make a bit more sense.